
Your CargoVans Dashboard
Get familiar with the main areas of your carrier dashboard and use them to understand the freight market at a glance.
Your CargoVans Dashboard is your starting point when you sign in. It gives you a quick view of freight activity and provides direct access to the tools you use throughout your day. Instead of replacing the Load Board, the Dashboard gives you the context you need before you start searching.
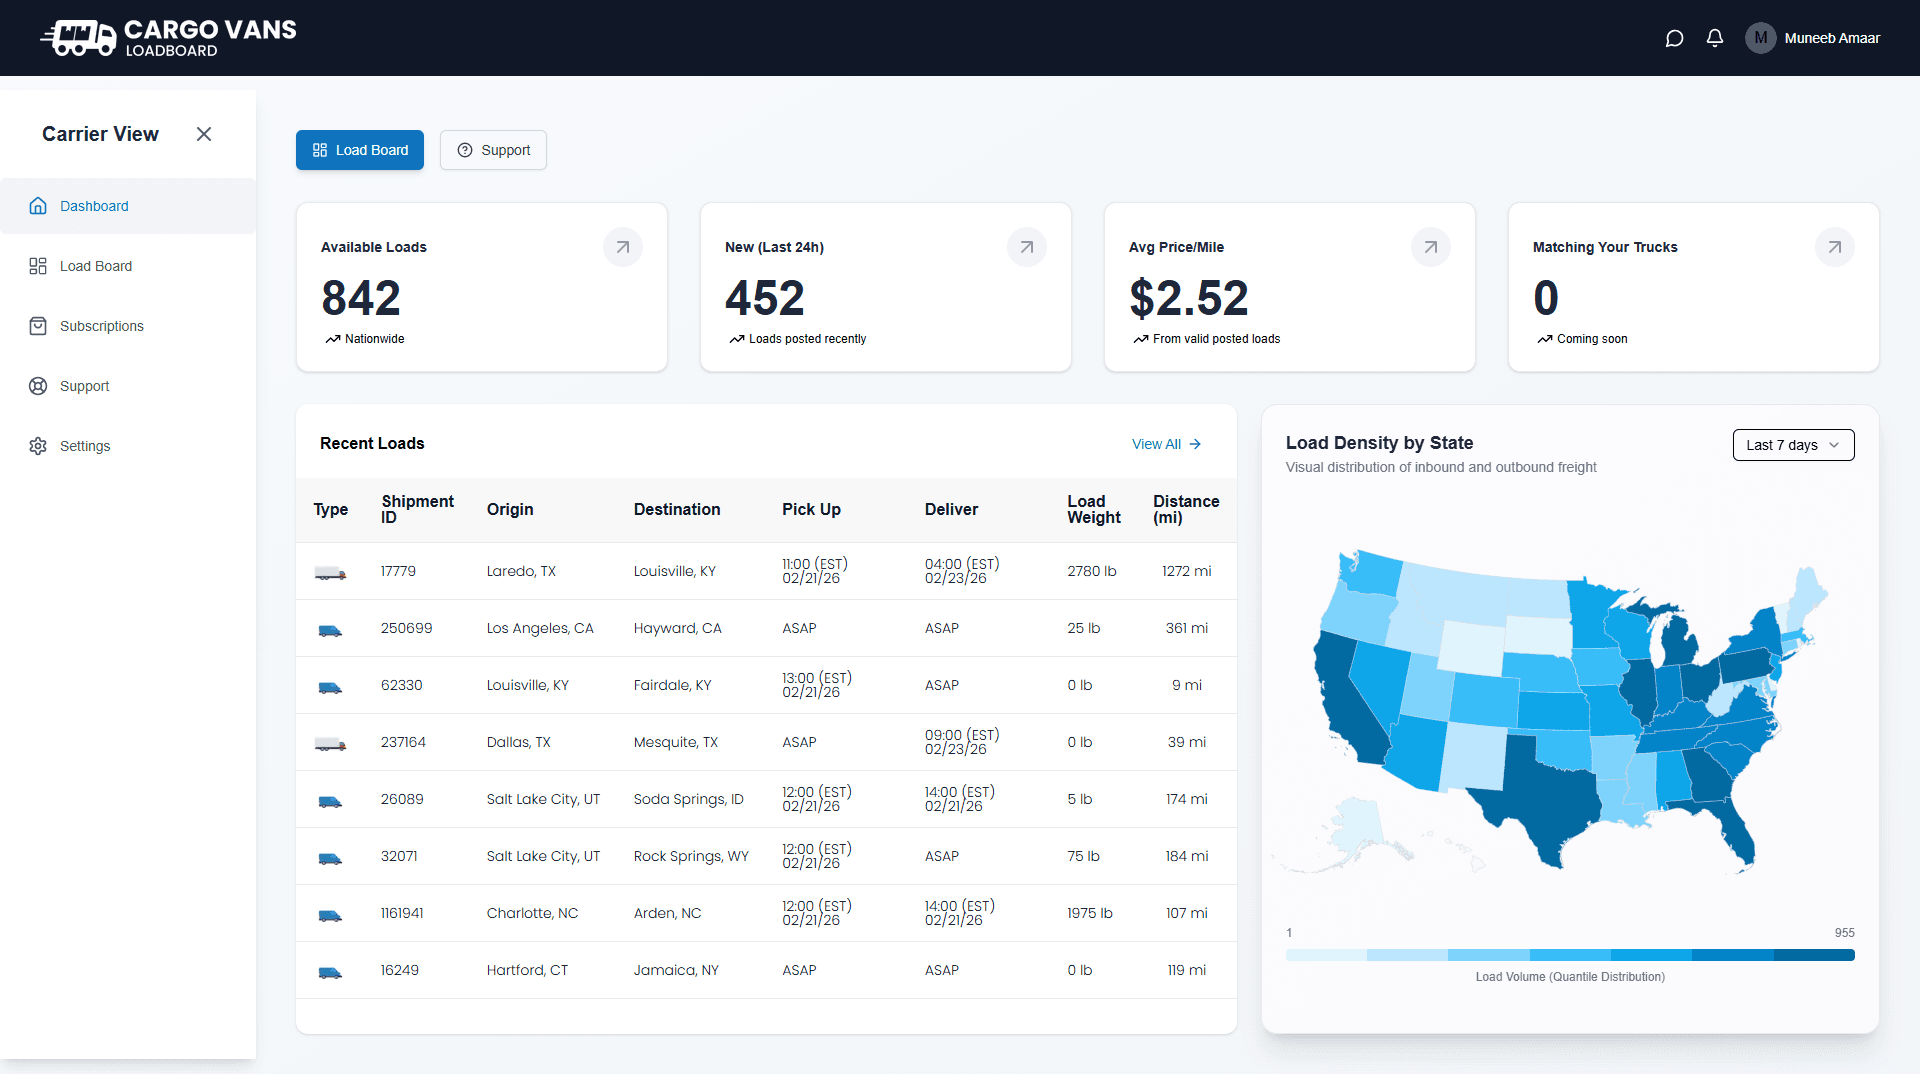
Six areas worth knowing
You don't need to spend your day on the Dashboard. Learn what each area tells you, use the information to decide where to focus, and move to the Load Board when you're ready to evaluate individual opportunities.
Quick Actions
Use the Load Board button to move directly into your freight search. The Support button gives you a direct path to the CargoVans support team when you need assistance.
Market Snapshot
The summary cards show available loads, recently posted loads, average price per mile, and matching truck information. Use these numbers as a quick view of current platform activity.
Recent Loads
Scan recently available opportunities without leaving the Dashboard. The table shows shipment ID, origin, destination, pickup and delivery timing, weight, and distance.
Load Density by State
The map visualizes inbound and outbound freight activity across the United States. Use the time-period selector to change the period being displayed and get a broader view of freight activity.
Notifications
The notification bell keeps important account and platform updates in one place. Check it for payment, subscription, security, and other important CargoVans notifications.
Your Account
Use your profile area to access account-related options and settings. Keeping your information current helps ensure your account and carrier details remain up to date.
Understanding the market snapshot
The four summary cards at the top of the Dashboard are designed to give you immediate context about the current freight environment on CargoVans.
- Available Loads, the number of loads currently available across the platform.
- New (Last 24h), the number of loads posted recently within the last 24 hours.
- Avg Price/Mile, the average price per mile calculated from valid posted loads.
- Matching Your Trucks, an area intended to identify loads matching your trucks; the current Dashboard indicates this capability is coming soon.
Using Recent Loads
Recent Loads is useful for getting a quick sense of the freight appearing on the platform. You can see where loads are originating, where they are going, how far they travel, and the pickup and delivery timing.
Use View All when you want to leave the Dashboard snapshot and work with the full Load Board. The Dashboard table is a quick scan; the Load Board is where you should perform your detailed search and evaluation.
Reading the Load Density by State map
The Load Density by State map gives you a visual overview of freight activity across the country. It represents the distribution of inbound and outbound freight and includes a time-period selector so you can change the period being viewed.
Make the Dashboard part of your routine
A useful routine is simple: check the Dashboard for a quick market snapshot, review recent opportunities, identify areas that may deserve attention, and then move to the Load Board to search and evaluate freight.
- Check the Dashboard for a quick view of current freight activity.
- Scan Recent Loads for opportunities and locations that may interest you.
- Look at Load Density by State to understand broader freight activity.
- Open the Load Board and apply the filters that match your operation.
- Evaluate individual loads before deciding whether they are worth pursuing.